
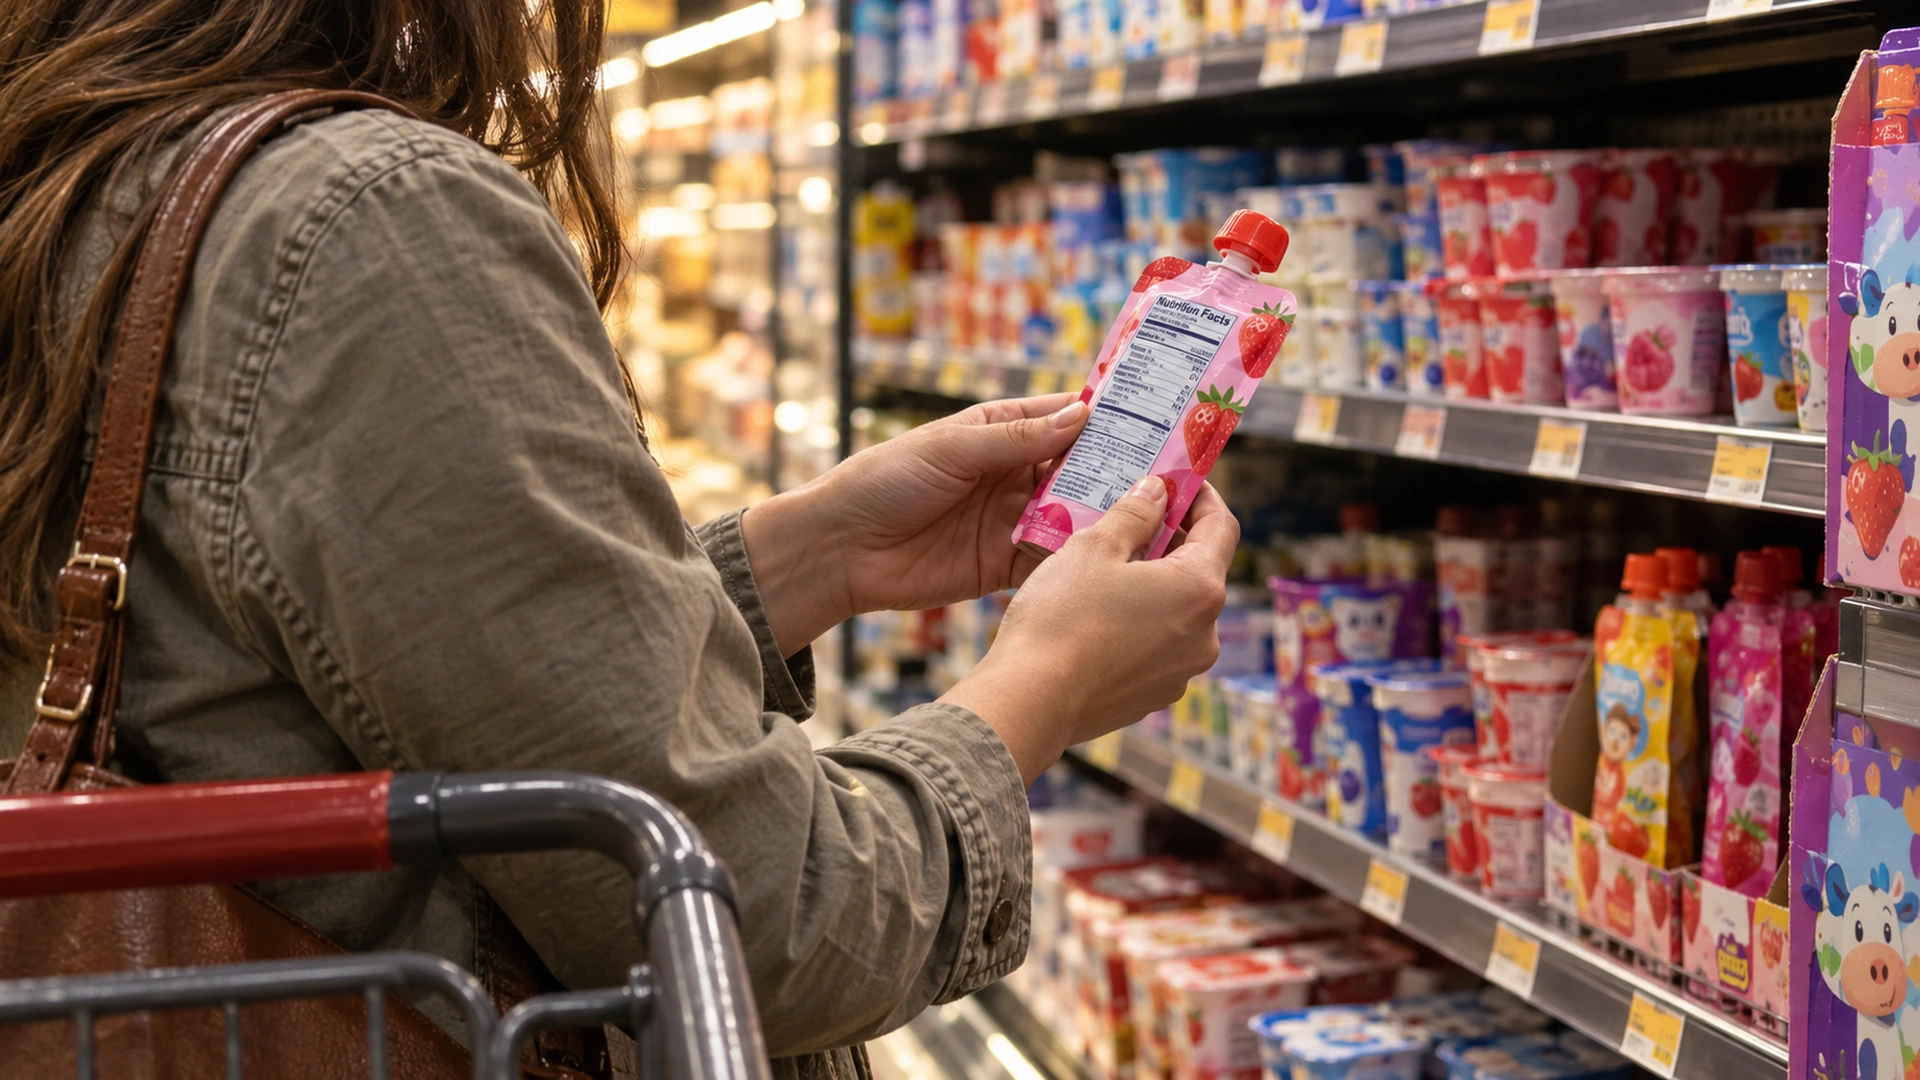
I thought I had the sugar thing handled — until I actually looked up the number.
The more labels I compared, the easier it was to see why this gets missed. The obvious stuff — soda, candy, dessert — is only part of the picture. Fruit snacks, granola bars, flavored yogurt, cereal, and sandwich ingredients can stack up without the day looking especially sugary.
So I built an ordinary-looking Tuesday from common breakfast, snack, lunch, and dinner foods and added up the label numbers. By dinner: 45 grams of added sugar. The juice box in the example is listed separately because 100% juice does not count as added sugar, even though the AAP still recommends limiting it. The AHA ceiling is 25 grams for the whole day. The January 2026 Dietary Guidelines changed how the federal guidance frames added sugar for children.
If you’re here because you want to know how much sugar should kids have per day — the numbers broken down by age, translated into real food, updated for what the guidelines actually say now — this is the article. The number comes first. Then I’ll explain what it means. Then I’ll show you what it looks like in the foods your kids probably eat every week.
Table of Contents
- The Short Answer: How Much Sugar Should Kids Have Per Day?
- Added Sugar vs. Total Sugar vs. Natural Sugar
- What the 2025–2030 Dietary Guidelines Actually Changed
- AHA Sugar Recommendations for Kids vs. 2026 Guidelines
- What 25 Grams Actually Looks Like in Your Kid’s Lunchbox
- How Much Sugar Should Kids Have Per Day by Age?
- AHA 25g Added Sugar Ceiling Tracker
- Signs Your Child May Be Getting Too Much Added Sugar
- How to Actually Use This at the Grocery Store
- Where to Go Next in the Sugar & Kids Guide
- Frequently Asked Questions
- The Bottom Line
The Short Answer: How Much Sugar Should Kids Have Per Day?
When you’re comparing guidance on daily sugar intake for kids, two different frameworks matter. The American Heart Association gives families a concrete daily ceiling. The 2025–2030 Dietary Guidelines do not give children a daily sugar “budget”; they emphasize avoiding or significantly limiting added sugars and cap a single meal at 10 grams. Here’s the practical comparison:
2026 Dietary Guidelines vs. AHA Added Sugar Limits by Age
| Age | AHA Recommendation (added sugar) | 2025–2030 Dietary Guidelines |
|---|---|---|
| Under 2 | Avoid added sugars during infancy and early childhood | None |
| 2–4 years | Less than 25g per day (about 6 tsp) | Avoid added sugars during early childhood |
| 5–10 years | Less than 25g per day (about 6 tsp) | No amount of added sugars recommended |
| 11–18 years | Less than 25g per day (about 6 tsp) | Significantly limit sugary drinks and highly processed foods; general guidance caps one meal at 10g added sugar |
The AHA’s scientific statement recommends no more than 25 grams of added sugar per day for ages 2–18, none for children under 2, and no more than one eight-ounce sugar-sweetened beverage per week. AAP parent guidance also uses the less-than-25-gram target for children 2 and older.
For a quick practical baseline: treat 25 grams as the AHA ceiling, not a target to spend. The federal guidance is stricter in direction—avoid added sugars in early childhood, recommends none for ages 5–10, and tells adolescents to significantly limit sugary drinks and highly processed foods.
Added Sugar vs. Total Sugar vs. Natural Sugar — What Actually Counts
Before any of these numbers can help you at the grocery store, you need to understand what counts and what doesn’t. This is the part most articles skip, which is why parents end up confused when they’re staring at a label in the cereal aisle.
Total sugar
The “Total Sugars” line on a nutrition label includes both: sugars that are naturally present in the food and sugars that were added during processing. A plain cup of milk has about 12 grams of total sugar. That’s lactose, natural milk sugar. It doesn’t count toward your child’s added sugar limit. Same with whole fruit. A banana has about 14 grams of total sugar, nearly all fructose that occurs naturally. That doesn’t count either.
Added sugar
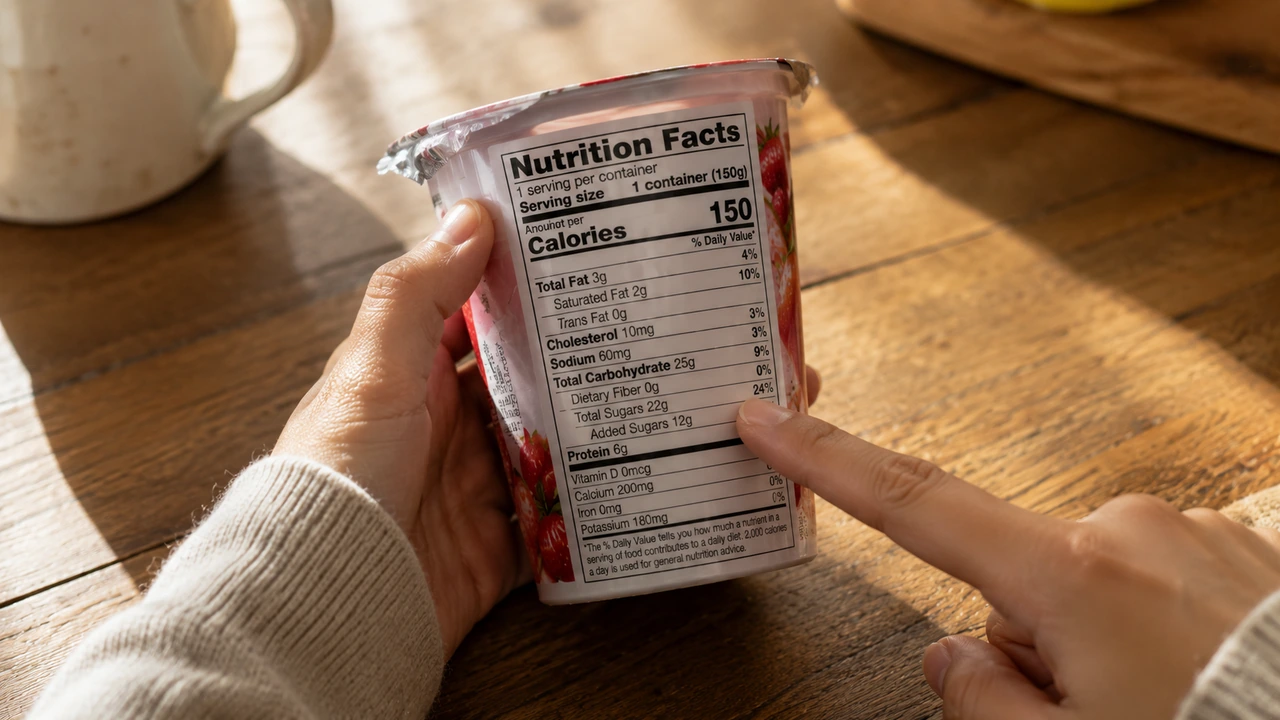
Added sugar is what the guidelines are actually restricting: any sugar or caloric sweetener (corn syrup, honey, maple syrup, or fruit juice concentrate used as a sweetener) that a manufacturer adds during processing, or that you add at home while cooking. Since 2020, the FDA has required nutrition labels to list added sugars as a separate indented line beneath Total Sugars, so you can see both numbers at a glance.
A strawberry yogurt that lists 22g total sugar and 12g added sugar means 10g is natural milk sugar (lactose) and 12g was added to make it sweet. The 12g is what you’re counting toward the daily limit.
Natural sweeteners
This is one of the most common points of confusion: “But I used honey — that’s natural, right?” Honey is natural, yes. It is also, for the purposes of these guidelines, added sugar. Honey, maple syrup, agave, coconut sugar, and fruit juice concentrate all count as added sugar in both the AHA and Dietary Guidelines frameworks. The distinction that matters isn’t natural vs. artificial; it’s naturally-occurring-in-the-original-food vs. added-at-any-point. If you’ve been using maple syrup as a “healthier” swap, I looked into that specifically — is maple syrup healthier than sugar for kids has the honest answer. More on natural sweeteners in the FAQ.
Once you can separate total sugar from added sugar, the next useful step is making that check repeatable on the packages you buy most. I put the same label logic into a printable you can use at home or in the store.
Use the Hidden Sugar Checklist on Everyday Labels
Inside: the 30-second label check, current label examples, common added-sugar names, practical swaps, and fridge-and-shop checklists.
Get the checklist and practical kids’ nutrition tips. Unsubscribe anytime.
Something went wrong. Please check your email address and try again.
What the 2025–2030 Dietary Guidelines Actually Changed
The 2025–2030 Dietary Guidelines for Americans were released on January 7, 2026, by the USDA and the Department of Health and Human Services. They represent the federal government’s updated nutritional guidance, issued every five years, and used as the scientific basis for school lunch programs, WIC recommendations, and federal nutrition policy.
The previous version (2020–2025) recommended limiting added sugar to less than 10% of total daily calories for everyone age 2 and older. For a typical 6-year-old consuming around 1,400 calories a day, that worked out to roughly 35 grams of added sugar, which is more permissive than the AHA’s 25g ceiling.
The new federal guidelines changed course from a percentage-based daily allowance to food- and meal-level guidance. They state that no amount of added sugar is recommended as part of a healthy diet and that one meal should contain no more than 10 grams. The age-specific sections say to avoid added sugars during infancy and early childhood, recommend no added sugar for middle childhood (ages 5–10), and tell adolescents to significantly limit sugary drinks and highly processed foods.
Infancy and early childhood: Avoid added sugars
Ages 5–10: No amount of added sugars recommended
Ages 11–18: Significantly limit sugary drinks and highly processed foods
General meal cap: No more than 10g of added sugar in one meal
This is why current sources can look inconsistent: the AHA still provides a daily ceiling, while the new federal document describes what belongs in a healthy diet and sets a per-meal cap. They answer slightly different questions.
AHA Sugar Recommendations for Kids vs. 2026 Guidelines
The AHA’s 25g ceiling still exists. It is a useful, concrete harm-reduction number and a solid reality check for most families. Here’s how I think about the two frameworks together:
The AHA limit is the maximum-you-don’t-want-to-exceed number—a ceiling that helps you catch obvious problems on a label. The 2025–2030 Dietary Guidelines give the direction: keep added sugars out of the foundation of a healthy diet, avoid them in younger childhood, and keep any single meal below 10 grams. I don’t think perfection is a useful test here. The practical goal is to make added sugar the exception rather than the baseline in every meal and snack.
For practical shopping, the AHA numbers remain the easiest to hold in your head: a 25g daily ceiling and no more than one eight-ounce sugar-sweetened beverage per week. The 2026 update adds a second useful check: try to keep each meal below 10g of added sugar, while moving the overall pattern toward less.
If the numbers start to blur, here’s what I actually hold in my head at the grocery store: 25 grams per day is the AHA ceiling, and 10 grams is the federal per-meal cap. Neither is a target to spend.
What 25 Grams of Added Sugar Actually Looks Like in Your Kid’s Lunchbox
Numbers are useful. Real food is what makes them stick.
Here’s an illustrative Tuesday built from common kids’ foods and representative label numbers. Brands and portions vary, so use it as a math example rather than a claim about one specific child’s diet:
A Typical Tuesday: Added Sugar in a “Healthy” Day of Eating
| Meal / Snack | Example food / drink | Added sugar |
|---|---|---|
| Breakfast | 1 bowl Honey Nut Cheerios with milk | 12g |
| Morning snack | 1 strawberry fruit pouch (“made with real fruit”) | 10g |
| Lunch | PB sandwich on whole wheat | 9g |
| Lunch drink | 1 “100% juice” juice box (no added sugar label) | 0g added* / 22g natural |
| Afternoon snack | 1 “granola and oat” bar | 8g |
| Dinner | Pasta with store-bought marinara, no dessert | 6g |
| Total added sugar | 45g added sugar |
*The juice box label says “No Added Sugar”—technically accurate. Its sugar is naturally occurring, so it does not count toward the added-sugar total. Whole fruit is still the better everyday choice because it provides fiber and is more filling, which is why pediatric guidance limits juice portions.
45 grams of added sugar. No candy. No soda. No birthday cake. On paper, it looks like a pretty ordinary day for a school-age child — which is exactly why the total is useful.
The number tells you how much was there; it does not explain what that pattern does inside the body. The separate guide on what happens when kids eat too much sugar looks at the evidence without turning one high-sugar day into a diagnosis.
The juice box is the one that still gets me. “No added sugar” on the front is technically accurate because the sugar came from the fruit itself. But juice has less fiber and is less filling than whole fruit. The AAP recommends limiting 100% fruit juice to 4 ounces per day for ages 1–3, 4–6 ounces for ages 4–6, and up to 8 ounces for older children.
I’m not sharing this to make anyone feel bad. That’s the trap: none of these foods looks like obvious junk. A lot of the hidden-sugar problem lives in the everyday “healthy” category, and once you know what to look for, the label check takes ten seconds.
If you want a curated list of lower-sugar snack options with the label numbers and practical trade-offs laid out, I have that in the best sugar-free snacks for kids roundup.
How Much Sugar Should Kids Have Per Day by Age?
Age-by-Age Added Sugar Limits with Real-Food Equivalents
| Age | AHA ceiling (added sugar) | 2026 DGA guidance | Real-food equivalent of the AHA limit |
|---|---|---|---|
| Under 2 | None | None | — |
| 2–4 years | <25g | Avoid added sugars during early childhood | A flavored yogurt with 12g uses almost half the AHA ceiling |
| 5–10 years | <25g | No amount recommended | A cereal serving with 12g uses almost half the AHA ceiling |
| 11–13 years | <25g | Significantly limit sugary drinks and highly processed foods; one meal ≤10g | A 20g sweetened drink plus an 8g bar exceeds the AHA ceiling |
| 14–18 years | <25g | Significantly limit sugary drinks and highly processed foods; one meal ≤10g | A 12g flavored yogurt plus a 20g sports drink exceeds the AHA ceiling |
The real-food column is the one worth memorizing. Abstract gram counts don’t stick. Seeing that one sweetened breakfast can use roughly half the AHA daily ceiling—and exceed the federal per-meal cap—does.
If you’re working on cereals specifically, I went through more than 30 labels and put together a list of low-sugar cereals that made the final comparison shortlist. If you want to see how these limits apply to your child’s specific age, the calculator below shows it in one step.
AHA 25g Added Sugar Ceiling Tracker
Enter your child’s age and how much added sugar they’ve already had today to compare it with the AHA ceiling. This is a harm-reduction reference, not a target to spend.
Signs Your Child May Be Getting Too Much Added Sugar
Once you know the reference numbers, the next question most parents have is: how do I tell if our usual pattern is too high? The science here is real—but often overstated. I’m not going to tell you sugar causes ADHD or that a granola bar explains your child’s focus problems. The research doesn’t support that framing; the separate guide on sugar and hyperactivity examines that claim directly.
What consistent research does support is that diets chronically high in added sugar are associated with several things worth watching:
- Dental issues. Frequent exposure to sugary foods and drinks raises cavity risk. The CDC’s cavity guidance identifies sugary foods and drinks—especially between meals—as a risk factor.
- A pattern of sweetened drinks and snacks crowding out meals. This is easier to verify from a short food log than from mood or behavior alone.
- Repeatedly exceeding the label-based reference numbers. The Added Sugars line gives you objective information; a single “symptom” does not.
None of these are diagnostic. If you want a more careful way to review the pattern, the guide to signs of too much sugar in children separates observable diet clues from symptoms that can have many causes. Health or development concerns still belong in a pediatrician conversation.
How to Actually Use This at the Grocery Store
Knowing the recommended sugar intake for kids by age is step one. Using it without spending forty minutes reading labels on a Tuesday night is step two. Here’s the quick filter I use when comparing labels:
Go straight to the Added Sugars line. It’s indented under Total Sugars on any label printed after 2020. I flag anything with more than 8–10g of added sugar per serving for a closer look, because two or three items at that level can use most of the 25g AHA ceiling quickly. I use about 5g per snack item as a rough comparison filter, not a medical cutoff. If you want a step-by-step walkthrough you can do at the store with your kids, I made a guide to reading nutrition labels with kids—including a printable quick-reference sheet.
Check the flavored version against the plain one. Plain yogurt vs. strawberry yogurt. Unflavored oatmeal vs. the individual flavored packets. The flavor almost always means added sugar, and the difference is usually 8–15g per serving. If you’re rebuilding the breakfast rotation from scratch, the healthy breakfast ideas for kids list has 20+ options that avoid this problem entirely — quick enough for actual school mornings.
Juice is not added sugar, but portions still matter. “No added sugar” means nothing was added; it does not make juice equivalent to whole fruit. The AAP’s upper limits are 4 oz for ages 1–3, 4–6 oz for ages 4–6, and up to 8 oz for older children. For practical replacements, the sugar-free drinks for kids guide compares everyday options without treating juice as soda.
The “healthy” halo doesn’t mean low sugar. Organic, made-with-real-fruit, no-artificial-colors: none of these mean low added sugar. Some organic granola bars still carry double-digit added sugar. Front-of-package claims don’t tell you that number; the Nutrition Facts label does. I catalogued the specific products that fool most parents in hidden sugars in kids’ foods — the ones with the best packaging and the worst labels.
Look at the whole meal, not just snacks. Jarred sauces, sweetened dressings, and convenience sides can quietly add several grams at dinner. The easy healthy family dinners guide gives you realistic meal combinations when dinner—not the snack drawer—is the sticking point.
Where to Go Next in the Sugar & Kids Guide
This pillar covers the numbers. Use the group that matches what you’re trying to solve next:
Make practical changes
- How to Reduce Sugar in Your Child’s Diet Without Tantrums or Power Struggles — practical step-by-step for cutting added sugar without making mealtimes a battle.
- Healthy Breakfast Ideas for Kids — quick, lower-sugar breakfasts for real school mornings.
- Easy Healthy Family Dinners — practical dinner ideas that make the whole-day pattern easier.
Shop for lower-sugar options
- Best Sugar-Free Snacks for Kids — label comparisons, practical swaps, and lower-sugar picks.
- Best Low-Sugar Breakfast Cereal for Kids: 30+ Labels Compared — which cereals stand out after comparing added sugar and practical trade-offs.
- Sugar-Free Drinks for Kids — everyday drink choices beyond soda and juice.
Understand labels and sweeteners
- Hidden Sugars in “Healthy” Kids Foods — the products with the best packaging and the most misleading labels.
- How to Read Nutrition Labels With Your Kids — step-by-step walkthrough plus a printable quick-reference sheet.
- Is Maple Syrup Healthier Than Sugar for Kids? — how honey, maple syrup, and other sweeteners count.
Understand possible effects
- What Actually Happens to Kids’ Bodies When They Eat Too Much Sugar — the research on energy cycling, gut health, sleep, and dental effects.
- Does Sugar Cause Hyperactivity? — what controlled research shows versus what parents often observe.
- Is My Child Eating Too Much Sugar? — observable patterns without turning them into a diagnosis.
Frequently Asked Questions
The 2025–2030 Dietary Guidelines recommend no added sugar for middle childhood, defined as ages 5–10. The American Heart Association separately sets a ceiling of 25g per day for ages 2–18. For a 5-year-old, treat 25g as a ceiling rather than a budget: a flavored yogurt or cereal with 12g uses almost half of it and exceeds the federal 10g-per-meal cap.
Parents often expect one number, but the two frameworks answer different questions. The federal guidelines say to avoid added sugars during early childhood and recommend none for ages 5–10. The AHA separately uses 25g per day as a ceiling for ages 2–18. That ceiling is a practical harm-reduction reference, not an acceptable daily budget to spend.
No—whole fruit is not counted toward the added sugar limit. Its sugar occurs naturally and comes with fiber, water, and nutrients. Fruit juice also does not count as added sugar when nothing is added, but it has less fiber and is easier to consume quickly, so the AAP recommends portion limits: 4 oz per day for ages 1–3, 4–6 oz for ages 4–6, and up to 8 oz for older children.
The January 2026 guidelines moved away from the previous daily percentage framework. They say no amount of added sugar is recommended as part of a healthy diet and cap one meal at 10g. Their age sections say to avoid added sugars during infancy and early childhood, recommend none for ages 5–10, and tell adolescents to significantly limit sugary drinks and highly processed foods.
Yes — honey counts as added sugar under both the AHA and Dietary Guidelines frameworks whenever it’s used as an ingredient or sweetener. The same applies to maple syrup, agave, coconut sugar, date syrup, and other natural sweeteners. The distinction these guidelines make isn’t natural vs. refined; it’s naturally-occurring-in-the-original-food vs. added. One important note: the AAP recommends no honey at all for children under 12 months due to the risk of infant botulism.
Look for the “Added Sugars” line, which is indented directly under the “Total Sugars” line on any nutrition label updated after 2020. The number on that line is how many grams of sugar were added during processing — this is the number you compare against the daily limit. If a label predates the 2020 update and only shows Total Sugars, scan the ingredients list for added sweeteners: sugar, corn syrup, high-fructose corn syrup, honey, cane juice, fruit concentrate, and anything ending in “-ose” are all forms of added sugar.
Start with observable diet information rather than symptoms: frequent sweetened drinks and snacks, repeated label totals above the reference numbers, or sugary foods crowding out meals. Cavities are also associated with frequent sugar exposure, but none of these observations diagnoses a health condition. A short food log gives you something concrete to discuss with your pediatrician or dentist.
The Bottom Line
The number that changed how I read labels is simple: in the sample Tuesday above, breakfast plus the morning snack already reaches 22 grams of added sugar, and lunch pushes the running total to 31 grams — past the AHA’s 25-gram daily ceiling before the afternoon snack. The problem isn’t that the menu looks reckless. It’s that the packaging makes the total easy to underestimate.
Now you know what you’re counting and how the two reference points differ: 25g is the AHA daily ceiling, while 10g is the federal per-meal cap. The label-reading habit, snack swaps, and juice conversation follow from there.
If you only do one thing after reading this: start checking the Added Sugars line on the labels your child eats most often. It takes ten seconds and gives you a far more honest picture than any packaging claim ever will.
If you want a practical framework for making the changes without daily food battles, the how to reduce sugar in your child’s diet guide walks through it step by step. It’s manageable once you can see it clearly.
Reminder: I’m Sarah Malik, the editorial voice behind Healthy Boulder Kids. I research and compare nutrition guidance, labels, and practical options; I am not a doctor, registered dietitian, or healthcare professional. The numbers and guidelines above are general guidance for generally healthy children — if your child has diabetes, a growth or weight concern, or another medical condition, their needs may be different, so check with your pediatrician before using these numbers as an individual target.